| Characteristic | Employee numbers in thousands |
|---|---|
| - | - |
| - | - |
| - | - |
| - | - |
| - | - |
| - | - |
| - | - |
| - | - |
| - | - |
| - | - |
| - | - |
| - | - |
| - | - |
| - | - |
| - | - |
| - | - |
| - | - |
| - | - |
The chart is not accessible to screen readers. Please switch to the table view to access the data.
Download
Source
Source
Release date
July 2017
More information
Region
United Kingdom (England)
Survey time period
2006-2016
Supplementary notes
*Forecast
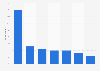
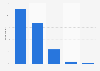
The series uses employment estimates from 1971 to 1980, quarterly ONS Workforce Jobs data on an annual average basis from 1981 to 2016, and projects employment by sector to 2050.
Citation formats