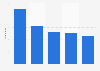
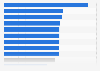
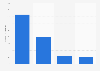
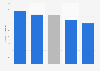
| Characteristic | 2014 | 2016 | 2017 |
|---|---|---|---|
| - | - | - | - |
| - | - | - | - |
| - | - | - | - |
| - | - | - | - |
| - | - | - | - |
| - | - | - | - |
| - | - | - | - |
| - | - | - | - |
| - | - | - | - |
| - | - | - | - |
| - | - | - | - |
The chart is not accessible to screen readers. Please switch to the table view to access the data.
Download
Source
Sources
Release date
October 2017
More information
Region
Worldwide
Survey time period
2014 to 2017
Number of respondents
1,876 respondents
Supplementary notes
* The source did not provide data for the 2014-15 survey.
** Data for 2014 was not reported by the source.
*** 2017 figures includes climate conditions, interior design, lack of kitchen facilities, lack of (free) parking, lack of natural light, lack of cell phone reception, constant changes.
The survey did not provide the survey method or age of respondents.
Number of respondents for previous surveys:
2013-14: 1,270 respondents
2015-16: 1,679 respondents.
Citation formats