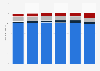
| Characteristic | Petrol cars | Diesel cars |
|---|---|---|
| - | - | - |
| - | - | - |
| - | - | - |
| - | - | - |
| - | - | - |
| - | - | - |
| - | - | - |
| - | - | - |
| - | - | - |
| - | - | - |
| - | - | - |
| - | - | - |
| - | - | - |
| - | - | - |
| - | - | - |
| - | - | - |
| - | - | - |
| - | - | - |
| - | - | - |
| - | - | - |
| - | - | - |
The chart is not accessible to screen readers. Please switch to the table view to access the data.
Download
Source
Sources
Release date
December 2021
More information
Region
United Kingdom (Great Britain)
Survey time period
2000 to 2020
Supplementary notes
These figures are registration weighted (weighted to account for the relative sales of different models of cars
These figures are obtained under consistent , carefully controlled laboratory conditions and do not reflect external factors such as cold starts, differing driving conditions, different loads carried, etc.
This statistic is using original data from the Department for Transport and includes copyright material licensed under 漏 Crown, the
Citation formats