| Characteristic | FDI in million U.S. dollars |
|---|---|
| - | - |
| - | - |
| - | - |
| - | - |
| - | - |
| - | - |
| - | - |
| - | - |
| - | - |
| - | - |
The chart is not accessible to screen readers. Please switch to the table view to access the data.
May 2022
Japan
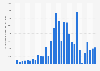
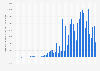
2012 to 2021
balance of payments basis, net and flow
Figures after 2014 are compiled according to the directional principle; that is, investments from an affiliated company in its parent company are recorded as withdrawals from the parent company.
Figures were first released in Japanese yen and converted to US dollars quarterly using Bank of Japan average inter-bank rates. From 2014 onwards, the annual revision data are converted using annual average rates.
Because the BOP related statistics have been revised, there is no strict continuity in the data before 2013 and after 2014.
Negative values indicate net inflow.
1 U.S. dollar equals 129.43 Japanese yen or 0.93 euros as of June 2022.
Values have been rounded.