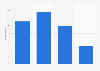
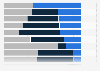
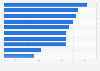
| Characteristic | Share of respondents |
|---|---|
| - | - |
| - | - |
| - | - |
| - | - |
| - | - |
| - | - |
| - | - |
| - | - |
| - | - |
| - | - |
The chart is not accessible to screen readers. Please switch to the table view to access the data.
Download
Source
Source
Release date
July 2017
More information
Region
India
Survey time period
2017
Number of respondents
2,166 respondents
Special properties
Across 10 cities in the country
Method of interview
Face-to-face interviews, telephone interviews
Supplementary notes
Title as phrased by the source: "Percentage of respondents who feel unsafe on Indian roads".
The source did not mention the time period of survey. The date mentioned is the date of publication.
Citation formats