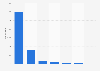
| Characteristic | Number of employees |
|---|---|
| - | - |
| - | - |
| - | - |
| - | - |
| - | - |
| - | - |
| - | - |
| - | - |
| - | - |
| - | - |
| - | - |
| - | - |
| - | - |
The chart is not accessible to screen readers. Please switch to the table view to access the data.
Download
Source
Source
Release date
June 2023
More information
Region
South Korea
Survey time period
2010 to 2022; as of March 1 of each year
Number of respondents
465 higher education institutions
Special properties
Figures include both temporary and regular employees
Supplementary notes
The source did not provide a date of publication. The date used here is the access date.
2020 figure updated based on updated reports.
Citation formats