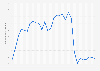
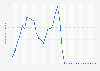
| Year | Avaiable seat miles in billions |
|---|---|
| - | - |
| - | - |
| - | - |
| - | - |
| - | - |
| - | - |
| - | - |
| - | - |
| - | - |
| - | - |
| - | - |
| - | - |
| - | - |
| - | - |
| - | - |
| - | - |
| - | - |
| - | - |
The chart is not accessible to screen readers. Please switch to the table view to access the data.
Download
Source
Source
Release date
March 2022
More information
Region
Worldwide
Survey time period
2004 to 2021
Supplementary notes
* All values are for scheduled flights only and have been rounded.
The figures have been rounded.
Please select "All U.S. Carriers" from the drop-down list to retrieve the correct data.
Citation formats