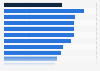
| Characteristic | Economic freedom index score |
|---|---|
| - | - |
| - | - |
| - | - |
| - | - |
| - | - |
| - | - |
| - | - |
| - | - |
| - | - |
| - | - |
| - | - |
| - | - |
| - | - |
| - | - |
| - | - |
| - | - |
| - | - |
| - | - |
| - | - |
| - | - |
| - | - |
| - | - |
| - | - |
| - | - |
| - | - |
| - | - |
| - | - |
| - | - |
| - | - |
| - | - |
| - | - |
| - | - |
| - | - |
The chart is not accessible to screen readers. Please switch to the table view to access the data.
Download
Source
Source
Release date
December 2016
More information
Region
Mexico
Survey time period
2014
Supplementary notes
The economic freedom index is calculated by the Fraser Institute yielding a score between 1 and 10, with 10 representing the highest degree of economic freedom. For all components, each observation was transformed into a number from zero to 10 and an average taken.
Citation formats