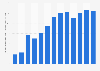
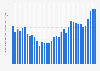
| Characteristic | Number of employees in thousands |
|---|---|
| - | - |
| - | - |
| - | - |
| - | - |
| - | - |
| - | - |
| - | - |
| - | - |
| - | - |
The chart is not accessible to screen readers. Please switch to the table view to access the data.
Download
Source
Sources
Release date
September 2023
More information
Region
Japan
Survey time period
2012 to 2021
Special properties
refers to establishments with four or more persons engaged; excluding furniture
Supplementary notes
*Excluding establishments in enumeration districts which include restricted areas designated due to the Great East Japan Earthquake.
No figures were reported for 2015 by the source.
Persons employed refer to the regular employees, working proprietors and unpaid family workers.
Figures have been rounded.
Data prior to 2021 comes from previous editions of the Japan Statistical Yearbook and the Statistical Handbook of Japan.
Citation formats