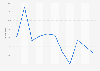
| Characteristic | Expenditure in trillion Japanese yen |
|---|---|
| - | - |
| - | - |
| - | - |
| - | - |
| - | - |
| - | - |
| - | - |
| - | - |
| - | - |
| - | - |
| - | - |
The chart is not accessible to screen readers. Please switch to the table view to access the data.
Download
Source
Sources
Release date
September 2017
More information
Region
Japan
Survey time period
April 1, 2005 to March 31, 2016
Supplementary notes
According to the source, the figures are based on ordinary accounts and are settled figures of the net total of prefectural and municipal government accounts after deducting duplications.
The source states, that 'fiscal year' refers to the 12 months beginning April 1 of the year stated.
Data for years prior to fiscal year 2011 comes from previous reporting.
Figures have been rounded.
100 Japanese yen equal 0.74 U.S. dollars or 0.70 euros as of December 2022.
Citation formats