

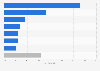


| Characteristic | Value in euros |
|---|---|
| - | - |
| - | - |
| - | - |
| - | - |
The chart is not accessible to screen readers. Please switch to the table view to access the data.
Download
Source
Source
Release date
September 2016
More information
Region
Italy
Survey time period
2015
Number of respondents
288 respondents
Special properties
companies
Method of interview
Questionnaire
Supplementary notes
The source adds the following information: responding companies are divided as follows 43.7 % are companies with up to 49 employees, 22.6% are companies with 50 to 250 employees and 33.6 % are companies with over 250 employees equally divided in three branches, 251-1000, 1001-5000, over 5001.
Citation formats

