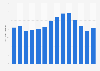
| Characteristic | Sales in million GBP |
|---|---|
| - | - |
| - | - |
| - | - |
| - | - |
| - | - |
| - | - |
| - | - |
| - | - |
| - | - |
| - | - |
| - | - |
| - | - |
The chart is not accessible to screen readers. Please switch to the table view to access the data.
Download
Source
Source
Release date
October 2019
More information
Region
United Kingdom
Survey time period
Financial year 2008 to financial year 2019*
Supplementary notes
* Financial years refer to:
52 weeks ended February 2, 2019;
53 weeks ended February 3, 2018;
52 weeks ended January 29, 2017;
53 weeks ended January 31, 2016;
52 weeks ended January 25, 2015;
52 weeks ended January 26, 2014;
52 weeks ended January 27, 2013;
52 weeks ended January 29, 2012;
52 weeks ended January 30, 2011;
53 weeks ended January 30, 2010;
52 weeks ended January 24, 2009;
52 weeks ended January 26, 2008.
Figures for years prior to 2016 were taken from previous accounts by the source.
This statistic is using original data from the Companies House and includes copyright material from 漏 Crown, licensed under the
Citation formats