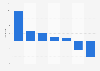
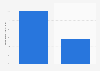
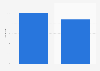
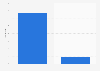
| Characteristic | Percentage change year-on-year |
|---|---|
| - | - |
| - | - |
| - | - |
| - | - |
| - | - |
| - | - |
| - | - |
| - | - |
| - | - |
| - | - |
| - | - |
| - | - |
| - | - |
| - | - |
| - | - |
| - | - |
The chart is not accessible to screen readers. Please switch to the table view to access the data.
Download
Source
Source
Release date
May 2017
More information
Region
Netherlands
Survey time period
1st quarter 2012 to 4th quarter 2016
Supplementary notes
* 'Non-food sales' covers sales within pet food, health, toiletry and household categories.
** The source combined data for Q1 and Q2 of 2013, 2014, 2015 and 2016, therefore the data is shown here as H1 2013, H1 2014, H1 2015 and H1 2016.
Citation formats