


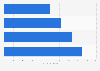

| Characteristic | Share of respondents |
|---|---|
| - | - |
| - | - |
| - | - |
| - | - |
| - | - |
| - | - |
The chart is not accessible to screen readers. Please switch to the table view to access the data.
Download
Source
Sources
Release date
January 2015
More information
Region
United States
Survey time period
November 2014
Number of respondents
515 respondents
Age group
18-40 years
Special properties
*female respondents only
Supplementary notes
The source phrases the question as follows: "In a typical week, approximately how often do you do each of the following?: Use mobile phone apps."
Citation formats



