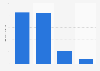
| Characteristic | Sales in million U.S. dollars |
|---|---|
| - | - |
| - | - |
| - | - |
| - | - |
| - | - |
The chart is not accessible to screen readers. Please switch to the table view to access the data.
Download
Source
Source
Release date
March 2016
More information
Region
United States
Survey time period
2012 to 2016
Supplementary notes
* Includes tables and sparkling wine.
** Nielsen Scantrack (off premise) for the 52 weeks ending June 23, 2012.
*** Nielsen Scantrack (off premise) for the 52 weeks ending June 22, 2013.
**** Nielsen Scantrack (off premise) for the 52 weeks ending June 21, 2014.
Nielsen Scantrack (off premise) for the 52 weeks ending June 20, 2015.
* Nielsen Scantrack (off premise) for the 52 weeks ending June 18, 2016.
Figures were rounded for better understanding of the statistic.
Citation formats