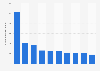
| Characteristic | Share of spending |
|---|---|
| - | - |
| - | - |
| - | - |
| - | - |
| - | - |
| - | - |
| - | - |
| - | - |
| - | - |
| - | - |
The chart is not accessible to screen readers. Please switch to the table view to access the data.
Download
Source
Sources
Release date
September 2020
More information
Region
United Kingdom (Great Britain)
Survey time period
2010 to 2019
Number of respondents
100,000*
Age group
16 years and older
Method of interview
Computer-assisted personal interviews (CAPI)
Supplementary notes
* An average 2,000 adults are surveyed weekly. The source states that this results in some 100,000 interviews per year.
Citation formats