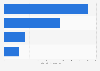
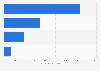
| Characteristic | Distribution of employees |
|---|---|
| - | - |
| - | - |
| - | - |
| - | - |
The chart is not accessible to screen readers. Please switch to the table view to access the data.
Download
Source
Source
Release date
April 2020
More information
Region
Worldwide
Survey time period
FY 2019
Supplementary notes
* As of December 31. According to the source, figures represent the average number of full-time equivalent employees. Employees of proportionately consolidated companies are included according to their percentage of consolidation. Employees of equity associates are not included.
Citation formats