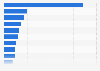
| Company size by revenue | Percentage of E&P bankruptcies |
|---|---|
| - | - |
| - | - |
| - | - |
The chart is not accessible to screen readers. Please switch to the table view to access the data.
Download
Source
Sources
Release date
February 2016
More information
Region
United States
Survey time period
July 1, 2014 to December 31, 2015
Supplementary notes
* This statistic includes only pure-play exploration & production (E&P) companies (i.e., excluding integrated oil majors and national oil companies); private unlisted companies with assets and liabilities of less than two million U.S. dollars, and publicly listed companies with assets or liabilities of less than 10 million U.S. dollars have been excluded.
Citation formats