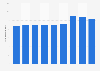
| Characteristic | Call minutes in billions |
|---|---|
| - | - |
| - | - |
| - | - |
| - | - |
| - | - |
| - | - |
| - | - |
| - | - |
| - | - |
| - | - |
| - | - |
| - | - |
| - | - |
| - | - |
| - | - |
| - | - |
The chart is not accessible to screen readers. Please switch to the table view to access the data.
Download
Source
Source
Release date
February 2024
More information
Region
Germany
Survey time period
2008 to 2023
Supplementary notes
* Up until 2015, the values refer to direct Telefonica customers. As of 2016, all voice traffic in the Telefonica network has been taken into consideration.
From the fourth quarter of 2014, E-Plus is included.
Citation formats