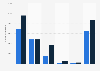
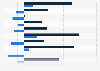
| Characteristic | Percent change in number of procedures |
|---|---|
| - | - |
| - | - |
| - | - |
| - | - |
| - | - |
The chart is not accessible to screen readers. Please switch to the table view to access the data.
Download
Source
Source
Release date
March 2016
More information
Region
Canada
Survey time period
April-September 2011 to April-September 2015
Supplementary notes
Quebec鈥檚 hip fracture repair data is not included due to the methodological differences in the data.
All-Canada estimates were calculated using provincially submitted surgical volumes and percentages meeting benchmarks.
Volumes and wait times for Nova Scotia have been updated for 2011 to 2014 and are different than those that appear in last
year鈥檚 report.
Citation formats