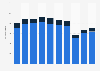
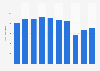
| Characteristic | Total sales in million GBP |
|---|---|
| - | - |
| - | - |
| - | - |
| - | - |
| - | - |
| - | - |
| - | - |
| - | - |
The chart is not accessible to screen readers. Please switch to the table view to access the data.
Download
Source
Source
Release date
September 2019
More information
Region
United Kingdom
Survey time period
Financial year 2010/11 to 2017/18*
Supplementary notes
* Financial year ending within the last week of August of each consecutive year.
Figures for 2015/16 and 2016/17 are based on the group's annual fillings to Companies House. Data for years prior to this is taken from financial results previously published by the group.
Figures have been rounded.
Citation formats