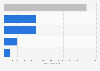
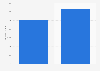
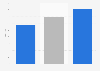
| Month | Share of couples who became engaged |
|---|---|
| - | - |
| - | - |
| - | - |
| - | - |
| - | - |
| - | - |
| - | - |
| - | - |
| - | - |
| - | - |
| - | - |
| - | - |
The chart is not accessible to screen readers. Please switch to the table view to access the data.
Download
Source
More information
Region
United States
Survey time period
2019
Number of respondents
27,250 respondents
Special properties
couples married between Januray 1st and December 31st, 2019
Supplementary notes
Respondents represent couples from all over the country with various ethnicities, income levels, race, age, sexual orientation and gender identity. To provide the most comprehensive view of research collected, WeddingWire has also included findings from ad hoc studies conducted in 2018, as well as behavioral data analyzed by the company's own team of data scientists. In a typical year, WeddingWire conducts research with more than 150,000 US brides, grooms, guests and wedding professionals.
Citation formats