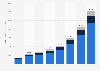
| Characteristic | Hotel | Flights | Meals | Snorkel trips |
|---|---|---|---|---|
| - | - | - | - | - |
| - | - | - | - | - |
| - | - | - | - | - |
| - | - | - | - | - |
| - | - | - | - | - |
| - | - | - | - | - |
| - | - | - | - | - |
| - | - | - | - | - |
| - | - | - | - | - |
| - | - | - | - | - |
The chart is not accessible to screen readers. Please switch to the table view to access the data.
March 2014
Central and South America
as of March 2014
* For a family/group of four.
The source does not specify a date of survey. The date given is the publication date.
Destinations are those which received the most visitors from the U.S. between November 15, 2013 and January 15, 2014.
Hotel prices reflect the average cost for a family/group of four to stay in a hotel for seven nights in each destination between March 1, 2014 and April 30, 2014.
Flight prices reflect average round-trips for a family of four from 20 of the busiest .S. airports to airports in each of the Caribbean destinations. Flight prices were found during February 17 to 24, 2014 for the eight Saturday-Saturday departure/return dates between March 1, 2014 and April 30, 2014.
Meal prices reflect the average cost of four two-course meals (including two beers and two sodas) for six nights from three mid-range restaurants.
Snorkel trip prices reflect the average cost of a three to four hour guided snorkling tour for four people from three tour operators.