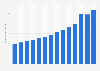
| Characteristic | aGVA in million GBP*** |
|---|---|
| - | - |
| - | - |
| - | - |
| - | - |
| - | - |
| - | - |
| - | - |
| - | - |
| - | - |
| - | - |
| - | - |
| - | - |
| - | - |
| - | - |
| - | - |
The chart is not accessible to screen readers. Please switch to the table view to access the data.
June 2024
United Kingdom
2008 to 2022
73,000*
excludes NHS trusts, local authority and central government bodies**
* The Annual Business Survey uses a sample of data from 62,000 businesses in the Non-Financial Economy in Great Britain and 11,000 in Northern Ireland to draw estimate totals for the whole business population.
** The source provides the following information: The ABS covers only the UK Non-Financial Business Economy which accounts for approximately two thirds of the UK economy in terms of Gross Value Added. Service industries are included, but for section Q only private provision. NHS trusts, local authority and central government bodies are excluded.
*** Approximate gross value added at basic prices.
For additional information about the visit the Office for National Statistics website.