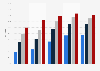
| Characteristic | Percentage of all learners |
|---|---|
| - | - |
| - | - |
| - | - |
| - | - |
| - | - |
The chart is not accessible to screen readers. Please switch to the table view to access the data.
Download
Source
Source
Release date
April 2014
More information
Region
United Kingdom (Scotland)
Survey time period
2009 to 2013
Supplementary notes
*Percentages were derived from number of total candidates in each year as well as the number of entries each year per subject.
For the 2012 exams, a new course was introduced: Physics (Revised). These figures include students who took both courses.
Citation formats