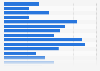
| Characteristic | Number of hospital transactions with MSA overlap |
|---|---|
| - | - |
| - | - |
| - | - |
| - | - |
| - | - |
| - | - |
| - | - |
The chart is not accessible to screen readers. Please switch to the table view to access the data.
Download
Source
Sources
Release date
September 2013
More information
Region
United States
Survey time period
2007 to 2013
Supplementary notes
* The source specifies that the term 鈥楳SA鈥� denotes either a metro- or a micropolitan statistical area. An MSA overlap occurs when both parties in a transaction operate a hospital in the same MSA.
** As of June 2013.
Citation formats