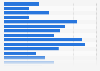
| Characteristic | Average number of acquired hospitals per transaction |
|---|---|
| - | - |
| - | - |
| - | - |
| - | - |
| - | - |
| - | - |
| - | - |
The chart is not accessible to screen readers. Please switch to the table view to access the data.
Download
Source
Sources
Release date
September 2013
More information
Region
United States
Survey time period
2007 to 2013
Supplementary notes
* As of June 2013.
Reported transactions exclude acquisitions by private equity firms or physician
groups, vertical transactions, abandoned transactions and other non-hospital-to-hospital transactions. Pending transactions are included.
Citation formats