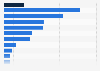
| Characteristic | Injuries per 100,000 employees |
|---|---|
| - | - |
| - | - |
| - | - |
| - | - |
| - | - |
| - | - |
| - | - |
| - | - |
The chart is not accessible to screen readers. Please switch to the table view to access the data.
Download
Source
Source
Release date
November 2017
More information
Region
United Kingdom (Great Britain)
Survey time period
April 1, 2009 to March 31, 2017
Supplementary notes
*Rate = employer-reported non-fatal injuries to employees per 100,000 employees. Self-employed workers are included.
**Figures for 2016/2017 are provisional.
Citation formats