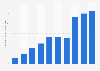
| Characteristic | Percentage of spending |
|---|---|
| - | - |
| - | - |
| - | - |
| - | - |
| - | - |
| - | - |
| - | - |
| - | - |
| - | - |
| - | - |
The chart is not accessible to screen readers. Please switch to the table view to access the data.
Download
Source
Source
Release date
August 2024
More information
Region
United Kingdom
Survey time period
2023
Number of respondents
5,630 households
Method of interview
Panel survey
Supplementary notes
The figures show weekly expenditure of households divided into decile groups, ranging from households with the lowest ten percent disposable income up to those with the highest disposable income.
* Figures for the lowest ten percent and the second decile group have been suppressed by the source because the unweighted sample amounts to less than 10 reporting households.聽
** The source notes that the figures for this income group should be used with extra caution because they are based on fewer than 20 reporting households.
Citation formats