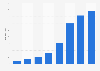
| Characteristic | Total assets in million U.S. dollars |
|---|---|
| - | - |
| - | - |
| - | - |
| - | - |
| - | - |
| - | - |
| - | - |
| - | - |
| - | - |
| - | - |
| - | - |
| - | - |
| - | - |
| - | - |
The chart is not accessible to screen readers. Please switch to the table view to access the data.
Download
Source
Source
Release date
September 2021
More information
Region
Worldwide
Survey time period
FY 2008 to FY 2021
Supplementary notes
For the fiscal years ended: June 29, 2008; June 28, 2009; June 27, 2011; June 24, 2012; June 30, 2013; June 29, 2014; June 28, 2015; June 26, 2016; June 25, 2017; June 24, 2018; June 30, 2019; June 28, 2020; June 27, 20213.
The data for 2008 through 2009 exclude Cree Microwave; the data for the fiscal year of 2012 include Ruud Lighting.
The values are compiled from several editions of the annual report.
Citation formats