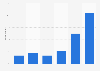
| Characteristic | Prefer print books | Prefer e-books | No preference |
|---|---|---|---|
| - | - | - | - |
| - | - | - | - |
| - | - | - | - |
| - | - | - | - |
| - | - | - | - |
| - | - | - | - |
The chart is not accessible to screen readers. Please switch to the table view to access the data.
Download
Source
Source
Release date
May 2011
More information
Region
United States
Survey time period
Oct. 11 to Nov. 2, 2010
Number of respondents
n = 1,491 (see also 'Further comments' below)
Special properties
University of California students and academical staff only
Supplementary notes
The survey was conducted at the University of Califonia only and for this reason its results may not be representative.
Arts and humanities: n = 203
Business and law: n = 57
Life and health sciences: n = 527
Physical sciences and engineering: n = 372
Social sciences: n = 179
Citation formats