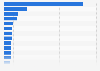
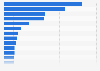
| Month and year | Million U.S. dollars |
|---|---|
| - | - |
| - | - |
| - | - |
| - | - |
| - | - |
| - | - |
| - | - |
| - | - |
| - | - |
| - | - |
| - | - |
| - | - |
| - | - |
| - | - |
| - | - |
| - | - |
| - | - |
| - | - |
| - | - |
| - | - |
| - | - |
| - | - |
| - | - |
| - | - |
| - | - |
| - | - |
| - | - |
| - | - |
| - | - |
| - | - |
| - | - |
| - | - |
| - | - |
| - | - |
| - | - |
| - | - |
| - | - |
| - | - |
| - | - |
| - | - |
| - | - |
| - | - |
| - | - |
| - | - |
| - | - |
| - | - |
| - | - |
| - | - |
| - | - |
| - | - |
| - | - |
| - | - |
The chart is not accessible to screen readers. Please switch to the table view to access the data.
Download
Source
Source
Release date
June 2024
More information
Region
United States (California)
Survey time period
January 2020 to April 2024
Supplementary notes
Figures refer to the sum of manufactured and non-manufactured commodities.
By NAICS-based product code groupings.
Not seasonally adjusted.
* Includes agricultural, forestry, fishery products, mineral commodities, scrap, waste and used or second-hand merchandise.
The source did not provide an exact date of release. In this statistic, date of access is used in lieu of date of release.
Citation formats