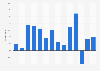
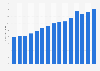
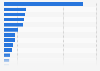
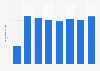
| Year | In billion U.S. dollars |
|---|---|
| - | - |
| - | - |
| - | - |
| - | - |
| - | - |
| - | - |
| - | - |
| - | - |
| - | - |
| - | - |
The chart is not accessible to screen readers. Please switch to the table view to access the data.
December 2013
United States
2000, 2004 to 2012
Includes only Government National Mortgage Association (GNMA), Federal National Mortgage Association (FNMA), Federal Home Loan Mortgage Corporation (FHLMC) mortgage-backed securities (MBS) and collateralized mortgage obligations (CMOs) and private-label MBS/CMOs. Beginning with 2004, Sallie Mae has been excluded from 鈥淚ssuance in the U.S. Bond Market鈥� data.
Primary dealer transactions
Based on data supplied by Board of Governors of the Federal Reserve System, U.S. Department of Treasury, Thomson Reuters, FHLMC, FNMA, GNMA, Federal Home Loan Banks, Student Loan Marketing Association, Federal Farm Credit Banks, Tennessee Valley Authority, Bloomberg, Loan Performance, Dealogic and Municipal Securities Rulemaking Board.
*The figure from 2004 has been taken from a previous Census Bureau publication.