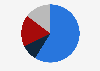
| Characteristic | Medicare | Medicaid | Other government | Private payer* | Uncompensated care** | Non-patient*** |
|---|---|---|---|---|---|---|
| - | - | - | - | - | - | - |
| - | - | - | - | - | - | - |
| - | - | - | - | - | - | - |
| - | - | - | - | - | - | - |
The chart is not accessible to screen readers. Please switch to the table view to access the data.
Download
Source
Source
Release date
August 2022
More information
Region
United States
Survey time period
1980, 2000, 2016, and 2020
Supplementary notes
Data for community hospitals. Percentages were rounded, so they possibly do not add to 100 percent in all years. No data was provided for "other government" and "non-patient" in 2020.
* Private payer formulas were updated in 2014 to account for the change in bad debt calculations, which is now reported as a deduction from revenue rather than a expense.
** Uncompensated care represents bad debt expense and charity care, at cost.
*** Non-patient represents costs for cafeterias, parking lots, gift shops and other non-patient care operating services and are not attributed to any one payer.
Citation formats