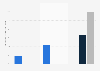
| Characteristic | United States | Europe | World | China | World excl. United States and China | Africa |
|---|---|---|---|---|---|---|
| - | - | - | - | - | - | - |
| - | - | - | - | - | - | - |
| - | - | - | - | - | - | - |
| - | - | - | - | - | - | - |
The chart is not accessible to screen readers. Please switch to the table view to access the data.
Download
Source
Sources
Release date
April 2026
More information
Region
Worldwide
Survey time period
2020 to 2025
Supplementary notes
Figures for 2021 and 2022 are not available.
According to the source, this indicator shows what share of a country's or region's total electricity demand comes from data centers. Figures include total data-center electricity use (including cooling and other support systems), across both general purpose and AI-specialized servers.聽
Citation formats