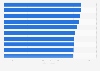
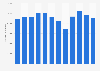
| Characteristic | Yes, absolutely | Rather | Rather not | No, not at all |
|---|---|---|---|---|
| - | - | - | - | - |
| - | - | - | - | - |
| - | - | - | - | - |
| - | - | - | - | - |
| - | - | - | - | - |
| - | - | - | - | - |
The chart is not accessible to screen readers. Please switch to the table view to access the data.
Download
Source
Sources
Release date
October 2022
More information
Region
France
Survey time period
September 12 - 20, 2022
Number of respondents
1,005 respondents
Age group
18 years and older
Special properties
Residents in urban areas with 50,000 inhabitants and more
Method of interview
Computer-assisted web interviews (CAWI)
Supplementary notes
* The source adds the following information: "Sample of 1,346 French people aged 18 and over, living in urban areas of 50,000 inhabitants or more, and 1,033 public transport users, from the GMI panel and representative of the French population (source INSEE)."
The question was formulated by the source as follows: "Why do they recommend public transport?"
The data prior to 2017 come from previous editions of this report.
Citation formats