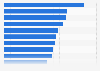
| Characteristic | Share of roadways with speeds below 25 mph |
|---|---|
| - | - |
| - | - |
| - | - |
| - | - |
| - | - |
| - | - |
| - | - |
| - | - |
| - | - |
| - | - |
| - | - |
The chart is not accessible to screen readers. Please switch to the table view to access the data.
Download
Source
Source
Release date
June 2023
More information
Region
North America, United States
Survey time period
September to October 2022
Special properties
data includes average speed on all primary and secondary roadway segments with over 200 pedestrian trips per day.
Supplementary notes
These cities were selected from the top 30 U.S. cities. "Top" means that they have the highest populations as collected from the Census 2020 cartographic boundary national places shapefile.
Citation formats