| Characteristic | Own / household car | Public transportation | Ride sharing / ride hailing (short distance incl. driver, e.g., Uber) | Own motorcycle | Own bicycle | Taxis | Other | Car sharing (short periods, e.g., by the minute, not traditional car rental) |
|---|---|---|---|---|---|---|---|---|
| - | - | - | - | - | - | - | - | - |
| - | - | - | - | - | - | - | - | - |
| - | - | - | - | - | - | - | - | - |
| - | - | - | - | - | - | - | - | - |
| - | - | - | - | - | - | - | - | - |
The chart is not accessible to screen readers. Please switch to the table view to access the data.
November 2023
Brazil
April 2019 to June 2023
12,136 respondents
18-64 years
includes trainees and apprentices.
Online survey
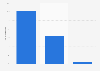
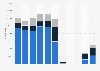
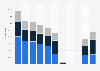
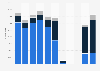
Data represents respondents' response who indicated that they work (full-time employed, part-time employed, self-employed, or as freelancer) to the survey question: "Which modes of transportation do you use for your daily commute to work/school/university? (multi-pick)"
Survey periods:
2019: 23 April 2019 to 15 November 2019
2020: 18 May 2020 to 11 November 2020
2021: 11 January 2021 to 13 December 2021
2022: 05 January 2022 to 14 December 2022
2023: 05 October 2022 to 26 September 2023
Respondent counts:
2019: 12,583
2020: 12,590
2021: 12,291
2022: 12,092
2023: 12,136