| Characteristic | Index score (0-9) |
|---|---|
| - | - |
| - | - |
| - | - |
| - | - |
| - | - |
| - | - |
| - | - |
| - | - |
| - | - |
| - | - |
| - | - |
| - | - |
| - | - |
| - | - |
| - | - |
| - | - |
| - | - |
| - | - |
| - | - |
| - | - |
| - | - |
| - | - |
The chart is not accessible to screen readers. Please switch to the table view to access the data.
Download
Source
Sources
Release date
November 2025
More information
Region
Asia, APAC
Survey time period
2026
Number of respondents
380 respondents
Special properties
among real estate industry experts
Method of interview
Questionnaire and personal interview
Supplementary notes
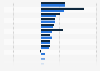
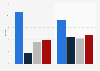
A score of less than 4 is generally poor, between 4 and 5.5 is fair, and more than 5.5 is generally good.
380 individuals were personally interviewed, completed surveys, or participated in roundtable meetings. Survey respondents were from Australia, China, Hong Kong, India, Japan, the Philippines, Singapore, and other countries or territories.
Citation formats