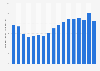
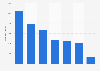
| Characteristic | Business entry rate |
|---|---|
| - | - |
| - | - |
| - | - |
| - | - |
| - | - |
| - | - |
| - | - |
| - | - |
| - | - |
| - | - |
| - | - |
| - | - |
| - | - |
| - | - |
| - | - |
| - | - |
| - | - |
| - | - |
| - | - |
| - | - |
| - | - |
| - | - |
| - | - |
| - | - |
| - | - |
| - | - |
| - | - |
| - | - |
| - | - |
| - | - |
| - | - |
| - | - |
| - | - |
| - | - |
| - | - |
| - | - |
| - | - |
| - | - |
| - | - |
| - | - |
| - | - |
| - | - |
| - | - |
| - | - |
| - | - |
| - | - |
| - | - |
The chart is not accessible to screen readers. Please switch to the table view to access the data.
Download
Source
Sources
Release date
April 2022
More information
Region
Japan
Survey time period
fiscal year 2020; the Japanese fiscal year starts on April 1 of the stated year and ends on March 31 of the following year
Special properties
business establishments with employees
Supplementary notes
Entry rate = number of businesses newly covered by employment insurance each fiscal year / number of businesses covered by employment insurance at the end of the previous fiscal year x 100.
As the figures are based on employment insurance data, the statistic does not include one-man businesses.
Citation formats