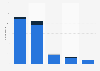
| Characteristic | Percent of women candidates | Percent of seats won by women |
|---|---|---|
| - | - | - |
| - | - | - |
| - | - | - |
| - | - | - |
| - | - | - |
| - | - | - |
| - | - | - |
| - | - | - |
| - | - | - |
| - | - | - |
| - | - | - |
| - | - | - |
| - | - | - |
| - | - | - |
| - | - | - |
| - | - | - |
| - | - | - |
| - | - | - |
| - | - | - |
| - | - | - |
The chart is not accessible to screen readers. Please switch to the table view to access the data.
Download
Source
Source
Release date
July 2020
More information
Region
United States
Survey time period
2010 to 2019
Special properties
Local elections in which ranked-choice voting was used
Supplementary notes
Number of ranked choice voting elections held in each location between 2010 and 2019:
Berkeley: 16
Oakland: 22
San Francisco: 27
San Leandro: 10
Telluride: 3
Cambridge: 10
Takoma Park: 5
Portland: 3
Eastpoint: 1
Minneapolis: 30
St. Louis Park: 1
St. Paul: 16
Buncombe: 1
Cumberland: 1
Rowan: 1
Las Cruces: 3
Santa Fe: 4
Payson: 1
Vineyard: 1
Citation formats