| Characteristic | Volume in numbers |
|---|---|
| - | - |
| - | - |
| - | - |
| - | - |
| - | - |
| - | - |
| - | - |
| - | - |
The chart is not accessible to screen readers. Please switch to the table view to access the data.
Download
Source
Sources
Release date
June 2021
More information
Region
India
Survey time period
Q1 2019 to Q4 2020
Special properties
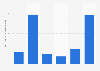
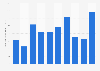
includes real estate and infrastructure exits.
Supplementary notes
According to the source, number of exits includes deals for which the exit value is not known.
Citation formats