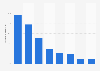
| Characteristic | Trade revenue in billion U.S. dollars |
|---|---|
| - | - |
| - | - |
| - | - |
| - | - |
The chart is not accessible to screen readers. Please switch to the table view to access the data.
Download
Source
Sources
Release date
February 2022
More information
Region
Europe
Survey time period
2017 to 2020
Supplementary notes
RBC estimates based on a comparison of Russian statistics, which used to include the DPR and LPR in trade with Ukraine, and Ukrainian official statistics, which did not include territories not controlled by the government
.
The figures exclude the trade of the DPR and the LNR with each other.
The figures were converted from RUB to USD by the source using the average annual exchange rate of the Russian Central Bank.
Citation formats