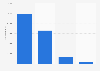
| Characteristic | Share of households |
|---|---|
| - | - |
| - | - |
| - | - |
| - | - |
| - | - |
| - | - |
| - | - |
The chart is not accessible to screen readers. Please switch to the table view to access the data.
Download
Source
Sources
Release date
March 2022
More information
Region
Japan
Survey time period
August 2020
Number of respondents
8,222 households*
Special properties
combining up to three passenger cars per household with the highest travel distance
Supplementary notes
*Households possessing passenger vehicles among 10,015 households that participated.
Percentages may not total 100 due to rounding.
Citation formats