| Characteristic | Number of facilities |
|---|---|
| - | - |
| - | - |
| - | - |
| - | - |
| - | - |
| - | - |
| - | - |
| - | - |
| - | - |
| - | - |
| - | - |
| - | - |
| - | - |
| - | - |
| - | - |
| - | - |
| - | - |
| - | - |
| - | - |
| - | - |
The chart is not accessible to screen readers. Please switch to the table view to access the data.
Download
Source
Source
Release date
October 2022
More information
Region
Hong Kong
Survey time period
2021
Supplementary notes
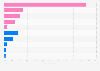
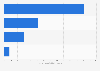
*Figure includes soccer pitches, hockey pitches, rugby pitches, soccer cum other ball games pitches, and rugby cum other ball games pitches, except gateball courts.
**Figure refers to the summation of the maximum number of basketball courts, volleyball courts and badminton courts that can be demarcated individually on relevant facilities (including multi-purpose courts).
Citation formats