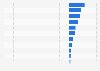
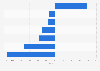
| Characteristic | Year on year change | Change on 2019 |
|---|---|---|
| - | - | - |
| - | - | - |
| - | - | - |
| - | - | - |
| - | - | - |
| - | - | - |
| - | - | - |
| - | - | - |
| - | - | - |
| - | - | - |
| - | - | - |
| - | - | - |
| - | - | - |
| - | - | - |
| - | - | - |
| - | - | - |
| - | - | - |
| - | - | - |
The chart is not accessible to screen readers. Please switch to the table view to access the data.
Download
Source
Source
Release date
September 2022
More information
Region
United States
Survey time period
March to August 2022
Supplementary notes
Data based on Mastercard Spending Pulse. The source adds the following note regarding data: "Mastercard SpendingPulse鈩� reports on national retail sales across all payment types in select markets around the world. The findings are based on aggregate sales activity in the Mastercard payments network, coupled with survey-based estimates for certain other payment forms, such as cash and check. As such, SpendingPulse鈩� insights do not in any way contain, reflect or relate to actual Mastercard operational or financial performance, or specific payment-card-issuer data."
Citation formats