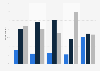


| Characteristic | Share of respondents |
|---|---|
| - | - |
| - | - |
| - | - |
| - | - |
| - | - |
| - | - |
The chart is not accessible to screen readers. Please switch to the table view to access the data.
Download
Source
Source
Release date
May 2022
More information
Region
Worldwide
Survey time period
February to March, 2021
Number of respondents
4,294 respondents
Special properties
developers, operations, and security professionals*
Supplementary notes
*Approximately 50% of respondents are GitLab customers. Respondents hold various job roles, represent several different industries and work for small-sized companies to large enterprises.
Citation formats



