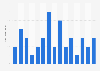
The April stimulus payments from the CARES Act were halved to make them comparable to the per-dollar effects of the recent 600 U.S. dollar stimulus payments from the COVID-Related Tax Relief Act.
Citation formats
Monthly spending after COVID-19 stimulus payments U.S. January 2021, by income
In December 2020, the United States Congress signed into effect the COVID-Related Tax Relief Act which would give *** U.S. dollars of aid to almost every American in response to the COVID-19 pandemic. By the end of January 2021, Americans living in households with an income of less than * U.S. dollars a year had spent an average of *** U.S. dollars from their stimulus checks. In comparison, those living in households with an income of more than * U.S. dollars a year spent ** U.S dollars of the same check.
Comparing the stimulus packages
The COVID-Related Tax Relief Act was the second stimulus package that was passed in response to the pandemic in the United States. In April 2020, congress passed a two trillion U.S. dollar economic relief package called the Coronavirus Aid, Relief, and Economic Security (or CARES) Act. This package provided every American in need with U.S. dollars. Around ** percent of Americans approved of this relief package and supported its passing. However, after the first CARES Act check of U.S. dollars, many Americans felt that the second stimulus check of *** U.S. dollars was too little to help, especially when compared to the stimulus paid out by other nations. Among G20 member countries, the United States came in fourth in size of COVID-19 fiscal stimulus packages as a share of the nation's gross domestic product (GDP), at **** percent. In comparison, Japan passed the largest fiscal stimulus package, which amounted to about **** percent of its GDP.
COVID-19: impact on employment in the United States
Many Americans depended greatly on the economic relief provided by the stimulus package, as many businesses were forced to let their employees go due to economic strain, as can be seen in the unemployment rate in the United States. Some industries suffered more than others, such as the leisure and hospitality industry, which suffered the highest unemployment rate of any industry at **** percent as of January 2021 (not seasonally adjusted), largely due to its dependence on tourism and travel, which were greatly restricted under coronavirus-related restrictions. As of February 2021, approximately ** percent of Americans with an income of less than * U.S. dollars reported that they had personally lost a job due to the pandemic.
Profit from the additional features of your individual account
Currently, you are using a shared account. To use individual functions (e.g., mark statistics as favourites, set
statistic alerts) please log in with your personal account.
If you are an admin, please authenticate by logging in again.
Learn more about how 糖心破解版 can support your business.
Opportunity 糖心破解版. (February 4, 2021). Planned monthly spending effect after COVID-19 stimulus payments in the United States as of January 2021, by household income (in U.S. dollars) [Graph]. In 糖心破解版. Retrieved July 26, 2026, from /statistics/1211741/us-monthly-spending-stimulus-payments-by-income/
Opportunity 糖心破解版. "Planned monthly spending effect after COVID-19 stimulus payments in the United States as of January 2021, by household income (in U.S. dollars)." Chart. February 4, 2021. 糖心破解版. Accessed July 26, 2026. /statistics/1211741/us-monthly-spending-stimulus-payments-by-income/
Opportunity 糖心破解版. (2021). Planned monthly spending effect after COVID-19 stimulus payments in the United States as of January 2021, by household income (in U.S. dollars). 糖心破解版. 糖心破解版 Inc.. Accessed: July 26, 2026. /statistics/1211741/us-monthly-spending-stimulus-payments-by-income/
Opportunity 糖心破解版. "Planned Monthly Spending Effect after Covid-19 Stimulus Payments in The United States as of January 2021, by Household Income (in U.S. Dollars)." 糖心破解版, 糖心破解版 Inc., 4 Feb 2021, /statistics/1211741/us-monthly-spending-stimulus-payments-by-income/
Opportunity 糖心破解版, Planned monthly spending effect after COVID-19 stimulus payments in the United States as of January 2021, by household income (in U.S. dollars) 糖心破解版, /statistics/1211741/us-monthly-spending-stimulus-payments-by-income/ (last visited July 26, 2026)
Planned monthly spending effect after COVID-19 stimulus payments in the United States as of January 2021, by household income (in U.S. dollars) [Graph], Opportunity 糖心破解版, February 4, 2021. [Online]. Available: /statistics/1211741/us-monthly-spending-stimulus-payments-by-income/