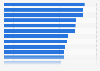
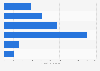
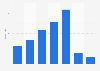
| Characteristic | ADR in U.S. dollars |
|---|---|
| - | - |
| - | - |
| - | - |
| - | - |
| - | - |
| - | - |
| - | - |
The chart is not accessible to screen readers. Please switch to the table view to access the data.
Download
Source
Source
Release date
July 2020
More information
Region
United States (New York)
Survey time period
July 3, 2020
Supplementary notes
* Figures show the ADR 50 percent, i.e. the median of the average daily rate of that type of property. For example for studio apartments, there is a supply of 1,195 properties - ADR 50 percent indicates the average daily rate of the 597th cheapest property. An ADR of 25 percent would indicate the average daily rate of the 298th cheapest property.
Citation formats