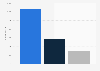
| Characteristic | Very important | Somewhat important | Not very important | Not important all |
|---|---|---|---|---|
| - | - | - | - | - |
| - | - | - | - | - |
| - | - | - | - | - |
The chart is not accessible to screen readers. Please switch to the table view to access the data.
Download
Source
Source
Release date
January 2020
More information
Region
Sweden
Survey time period
August 23 to September 6, 2019
Number of respondents
500 respondents
Age group
16-74 years
Special properties
Respondents who buy fish at least once a month
Method of interview
Online panel
Supplementary notes
Missing percentage points to 100 percent are probably due to rounding.
Percentage points exceeding 100 percent are probably due to rounding.
Citation formats